
Reading Histograms
Grade 6 Math Worksheets
Why do you use a histogram?
Histogram is an illustrative way to represent a particular data. It is shown in vertical bar formation for a particular input and with respect to the number of continuous data given, which is said to be the frequency in each category.
A histogram is a single block graph of rectangles where the area of each rectangle will be proportional to the frequency.
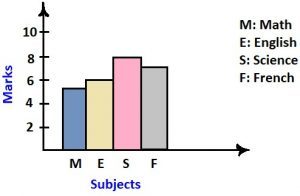
Example 1: The points scored by John in his school test was marked in 10 for subjects Math, English, Science, French as 5, 6, 8, 7 respectively. Represent the above data in a histogram.
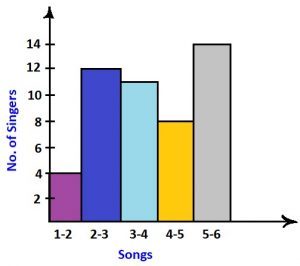
- Highest number of songs sung in a year.
- Least number of songs sung.
- of songs 14 singers sang.
- How many singers sang 3-4 songs?
In such a pictorial representation it is easy to identify and find out, calculate a specific detail instead of analyzing the whole data.
Solution:
- Grey colored bar on the graph states that 6 is the highest number of songs sung.
- Purple colored bar denotes 1 is least number of song sung.
- 5-6 songs were sung by 14 singers.
- 11 singers sang 3-4 songs.
Example 3: Following is the histogram view of a data showing the list of people who order home utilities online.
Basic items sold online are furniture, kitchen appliances, mobile phones and groceries.
- Find the product that is sold largely.
- How many people buy groceries online?
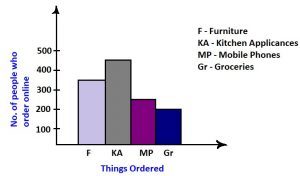
Solution:
- The product which is sold largely is kitchen appliances.
- Between 0-200 people buy groceries online.
- Use the histogram to identify how long a student spends time on gadgets on school off days.

a.How many students spend only 5-10 hours?
b.How long does 4 students spend on gadgets?
c.Number of students spending maximum number of hours.
- Sheila collected the details of no. of novels sold in a book fair and made a histogram of the data which showed the no. of books sold between 20-200 dollars.
a) Draw a histogram if following is the data collected.
| No. of books (novels) | Amount (in Dollars) |
| 20 | 55 |
| 30 | 80 |
| 40 | 75 |
| 50 | 150 |
| 60 | 30 |
| 70 | 105 |
| 80 | 125 |
b) How many books were sold between $150 and $105?
Answer key
- 3 students
- 10 – 15 hours
- 9 students
-
- Histogram made by Sheila will look like:

b.20 books were sold between $105 and $150.
Personalized Online Tutoring
eTutorWorld offers affordable one-on-one live tutoring over the web for Grades 2-12, Test Prep help for Standardized tests like SCAT, CogAT, SSAT, SAT, ACT, ISEE and AP. You may schedule online tutoring lessons at your personal scheduled times, all with a Money-Back Guarantee. The first one-on-one online tutoring lesson is always FREE, no purchase obligation, no credit card required.
For answers/solutions to any question or to learn concepts, take a FREE Demo Session.
No credit card required, no obligation to purchase.
Just schedule a FREE Sessions to meet a tutor and get help on any topic you want!
Learn more about Scientific Method and other important topics with 7th Grade Science Tutoring at eTutorWorld. Our expert science tutors break down the topics through interactive one-to-one sessions. We also offer the advantage of customized lesson plans, flexible schedules and convenience of learning from home.
Pricing for Online Tutoring
| Tutoring Package | Validity | Grade (1-12), College |
|---|---|---|
| 5 sessions | 1 Month | $124 |
| 1 session | 1 Month | $25 |
| 10 sessions | 3 months | $239 |
| 15 sessions | 3 months | $354 |
| 20 sessions | 4 months | $449 |
| 50 sessions | 6 months | $1049 |
| 100 sessions | 12 months | $2049 |
