
Reading Box-and-Whisker Plots
Grade 6 Math Worksheets
Box plot (also called as box and whisker plot) is a basic method to represent a given data on a graph.
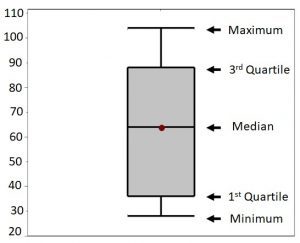
We draw a rectangle on it to show the second and third quartiles, with a vertical line within to show the median value. The lower and upper quartiles are shown as horizontal lines on both sides of the rectangle. This can be drawn both horizontally and vertically.
- Whispers
Whiskers are spread over a wider range apart from the quartile groups. From the minimum to the maximum data represents the whisker area.
- Median
The middle quartile is the mid-point of the data and is shown by the line that divides the box into two parts. This is called the median. Median is also called Quartile 2 or Q2. Half of the data is greater than or equal to this value and half is lesser than this value.
- Lower Quartile or First Quartile
It is the median of the lower half of the data set. 25% of values in the data set fall below the lower quartile (Q1) as shown in the above diagram.
- Upper Quartile or Third Quartile
It is the median of the upper half of the data set. 75% of values in the data set fall below the upper quartile (Q3) as shown in the above diagram.
- Inter-quartile Range
The difference between the lower and upper quartiles is called as the inter-quartile range. IQR = Q3 – Q1
Example 1:
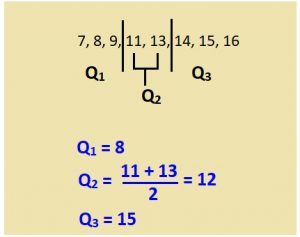
Find the median, quartile 1, quartile 3 for the given set of data.
9, 7, 8, 15, 14, 13, 11, 16
Solution:
Arrange the given data in ascending order: 7, 8, 9, 11, 13, 14, 15, 16
Example 2:
What is the inter quartile range of the given data set?
3, 5, 6, 9, 11, 15, 16, 18, 21, 23, 25, 27
Draw the box and whisker plot for the above data.
Solution:
Step 1: Arrange the data from least to greatest.
3, 5, 6, 9, 11, 15, 16, 18, 21, 23, 25, 27
Median of the above data is the middlemost data value.
We can see that, no. of items, n = 12.
Hence, median is the sum of 6th and 7th value in the given data set, divided by 2.
So, median, Q2 = =
= 15.5
Lower quartile, Q1 = it’s the median value of the lower half of the data, 3, 5, 6, 9, 11, 15
Median of the above data = =
= 7.5
Upper quartile, Q3 = it’s the median value of the data set, 16, 18, 21, 23, 25, 27
Median of 16, 18, 21, 23, 25, 27 = =
= 22
So, interquartile range (IQR) = Q3 – Q1 = 22 – 7.5 = 14.5
The “box” goes from Q1 to Q3, with a line drawn inside the box to show the location of the median, Q2.
Then whiskers are drawn to the endpoints (the lowest and the highest value in the given data set).
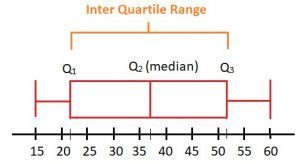
Note: Box and whisker plot can be drawn horizontal, as drawn above and vertical also.

Check Point
- The following numbers is the data of people who performed the different hours of voluntary service done in a week by teen age kids in a particular area. Find the median, and inter quartile range.
4, 6, 3, 2, 8, 5, 9, 11, 22, 13, 15, 5, 8
- From the following data
15, 20, 25, 30, 35, 40, 45, 50, 55, 60
Find the
a.Lower quartile
b.Upper quartile
c.Inter quartile range
d.Represent it graphically
Answer key
- Median is 8. Inter quartile range is 7.5 (IQR = Q3 – Q1 = 12 – 4.5 = 7.5)
2.
a.LQ or Q
1 = 22.5
b.UQ or Q3 = 52.5
c.IQR = 30
d.

Personalized Online Tutoring
eTutorWorld offers affordable one-on-one live tutoring over the web for Grades 2-12, Test Prep help for Standardized tests like SCAT, CogAT, SSAT, SAT, ACT, ISEE and AP. You may schedule online tutoring lessons at your personal scheduled times, all with a Money-Back Guarantee. The first one-on-one online tutoring lesson is always FREE, no purchase obligation, no credit card required.
For answers/solutions to any question or to learn concepts, take a FREE Demo Session.
No credit card required, no obligation to purchase.
Just schedule a FREE Sessions to meet a tutor and get help on any topic you want!
Learn more about Scientific Method and other important topics with 7th Grade Science Tutoring at eTutorWorld. Our expert science tutors break down the topics through interactive one-to-one sessions. We also offer the advantage of customized lesson plans, flexible schedules and convenience of learning from home.
Pricing for Online Tutoring
| Tutoring Package | Validity | Grade (1-12), College |
|---|---|---|
| 5 sessions | 1 Month | $124 |
| 1 session | 1 Month | $25 |
| 10 sessions | 3 months | $239 |
| 15 sessions | 3 months | $354 |
| 20 sessions | 4 months | $449 |
| 50 sessions | 6 months | $1049 |
| 100 sessions | 12 months | $2049 |
